Vimeo, Inc. Experiences Revision in Stock Evaluation Amid Strong Market Performance
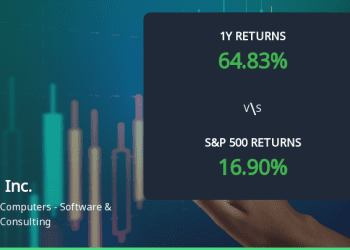
Vimeo, Inc. has recently revised its evaluation amid current market dynamics, with its stock price at $7.78. Over the past year, the company has achieved a 64.83% return, significantly outperforming the S&P 500. Various technical indicators present a mixed outlook, reflecting both bullish and bearish conditions. Vimeo, Inc., a small-cap player in the Computers - Software & Consulting industry, has recently undergone an evaluation revision reflecting its current market dynamics. The company's stock price is currently at $7.78, slightly down from the previous close of $7.80. Over the past year, Vimeo has demonstrated impressive performance, with a return of 64.83%, significantly outpacing the S&P 500's return of 16.90% during the same period. In terms of technical indicators, Vimeo's weekly MACD shows a bullish trend, while the monthly MACD is mildly bullish. The Bollinger Bands indicate a bullish stance on a monthly basis, suggesting a positive outlook for price volatility. However, the Relative Strength Index (RSI) reflects bearish conditions on both weekly and monthly scales, indicating some caution in momentum. The company's moving averages are bullish on a daily basis, which may suggest short-term strength. Despite mixed signals from other indicators like KST and Dow Theory, Vimeo's overall performance metrics highlight
Read moreDetails